I give
all credits to Rebecaa Gill (Copyright © 2017 Web Savvy
Marketing | @RebeccaGill)
How does Google
analytics get the data ?
·
Every time a page loads, the tracking code will
collect and send updated information about the user’s activity
·
Google Analytics groups this activity into a
period of time called a “sesson”
·
A session begins when a user navigates to a page
that includes the Google Analytics tracking code
·
A session ends after 30 minutes of inactivity
·
If the user returns to a page after a session
ends, a new session will begin
Accounts - An
account is your access point for Analytics, and the top- most level of
organization
Properties - A
property is a website, mobile application, or device
Views - A view is
your access point for reports or a defined view of data from a property
Advantages of Google
analytics
·
It’s free
·
It’s easy to install
·
It integrates with other Google products
·
Tracks acquisition, behavior, and conversions
·
It allows customized data collection
·
It allows custom report creation It tracks
ecommerce and goals
·
It’s being developed constantly, so new stuff
magically arrives
·
Google provides free training
Disadvantages
·
It tracks URL movement only It can be
overwhelming
·
It’s constantly changing
·
There are limitations with data usage like:
–
Accounts
–
Dashboards
–
Goals
·
Custom reports options are limited
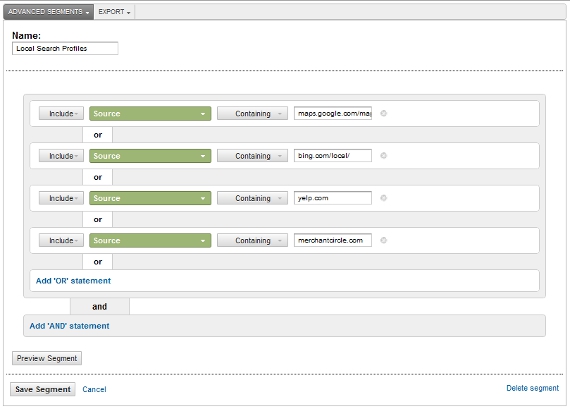
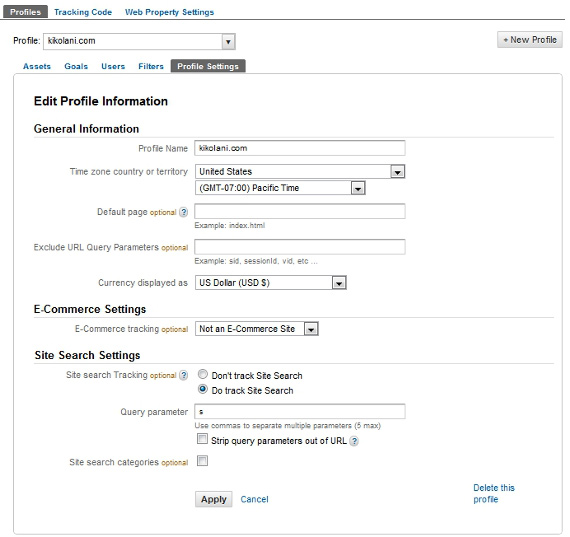
#1: Filters
Filters are used by
Views to segment the data into smaller groups
Filters can be used
to:
– Include only specific subsets data
– Exclude unwanted data like that
crazy spam that magically arrives
– Search and replace information
Common filter usage:
– Exclude internal traffic
– Include specific hostname
– Exclude dev site traffic
#2: Real-time Data
Best ways to use it:
– Track the popularity of new content
– Track the success of a social media
share
– Track the success of your email
campaign
– See whether a promotion is driving
traffic
– Watch visitor movement as it
happens
Available data
includes:
– Active users
– Pages being viewed
– Location of visitors
– Visitor source
– Conversions and events
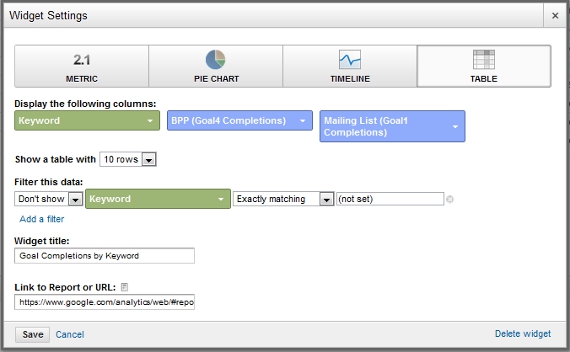
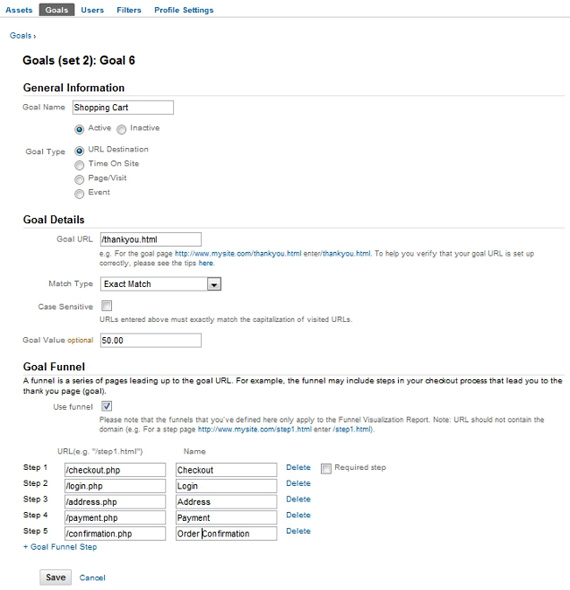
#3: Goals
Goals are configured
at the view level Goals can be applied to:
– Destination: Specific pages your
users visit
– Duration: How many pages they view
in a session
– Pages/Session: How long they stay
on your site
– Events: The events they trigger
while they are there
Every goal can have
a monetary value, so you can see how much that conversion is worth to your
business
When a visitor
completes a goal, Analytics records that as a “conversion”
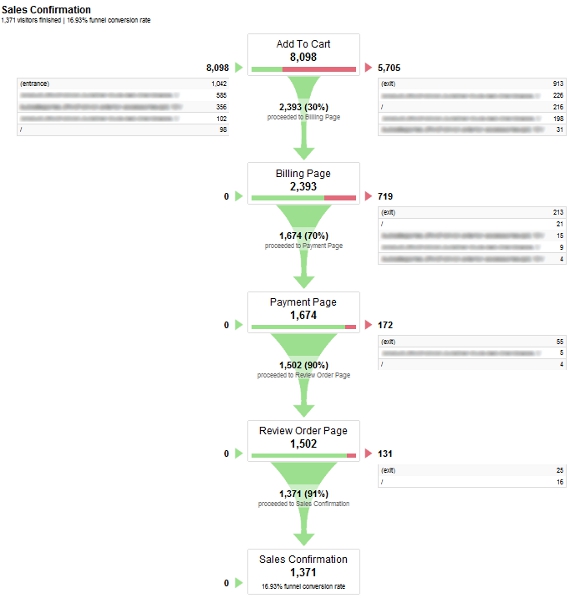
Goals use funnels so
you can also track failure to complete goals
Real-world usage:
– Contact form submissions (lead)
– Newsletter or podcast subscriptions
– A download of a ebook, white
papers, etc.
– An account creation
– Blog comment
– Review left
– A purchase
– An extended amount o time spent on
the website
Goals are limited to
20 per reporting view
To track more than
20 goals, you have to create an additional view for that property
Goals only apply to
the data you collect after the goal has been created
Goals can't be
deleted, but you can stop recording data for a goal
You have to have a
URL movement for goals to work - i.e. a contact page needs a thank you page
#4: Annotations
Annotations are
simply a way to date stamp something (really anything) that may have altered
traffic and data
Think of annotations
like virtual post-it notes
They are recorded at
the view level
Once added they are
available throughout the reports for this view
They can be private
or shared
Real-world examples
and applications include:
– Relaunch or redesign
– Hosting outage
– Malware or hacking attack
– Hire or fire an SEO
consultant/employee
– Specific marketing campaign
– Industry or competitor activity
– Search engine penalty
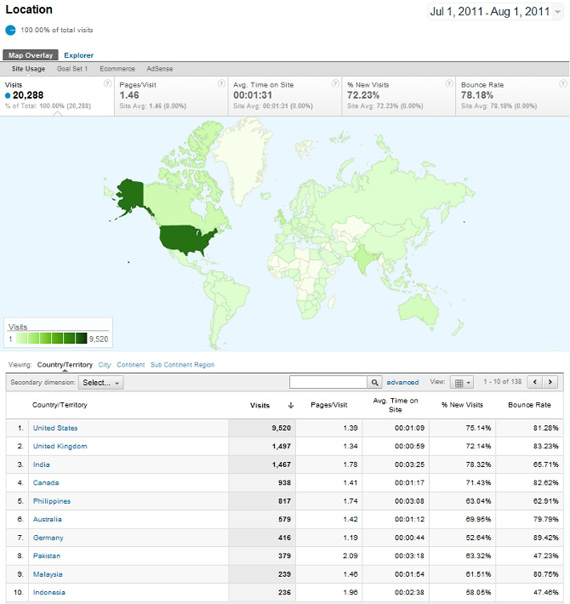
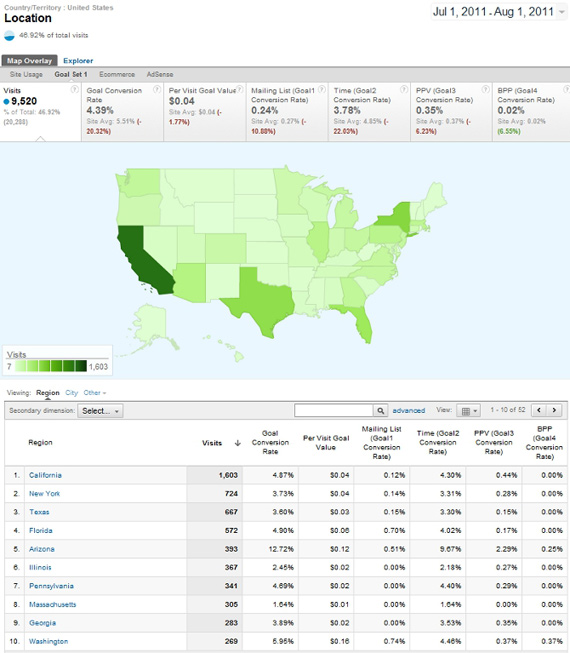
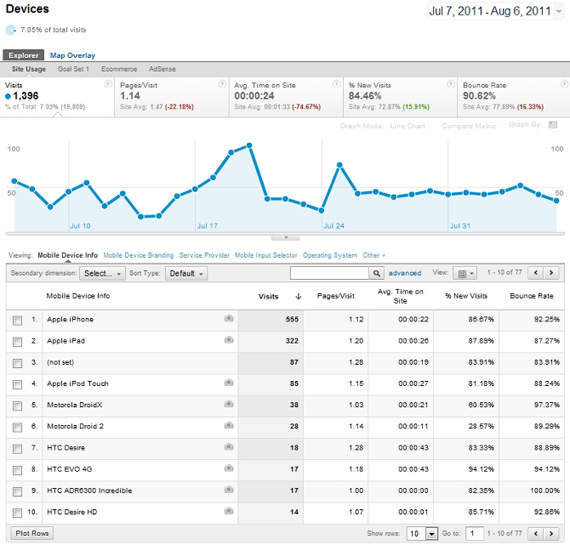
#5: Dimensions
Every Google
Analytics report contains two types of data: dimensions and metrics
A dimension is the
attribute of visitors to your website like:
– Source – organic, referral, email,
direct, etc.
– Device – desktop, tablet, mobile
– Geography – country, state, city,
etc.
A metric is a number
which is used to measure one of the characteristics of a dimension
A dimension can have
one or more characteristics –
i.e. pages per
session and bounce rate
Custom dimension can
be set up and used as an advanced segment in reports
My favorite use of
dimensions is to view conversions by source
When doing so you
don’t just see what leads or sales you have
You now see what
sources are driving those leads or sales
In this report the
number of conversions is the metric and source is the dimension
#6: Events
Events are user
interactions that can be tracked without the need of a page load
Examples of event
usage include:
– Video play, stop, pause
– Downloads
– Ad clicks
Events have three
core components:
– Category: Videos
– Action: Play
– Label: Schema Webinar Replay You
connect events to your website with Google Tag
Manager
#7: Google Tag
Manager
A tag is a snippet
of JavaScript code that collects data and sends information to other services
Tags can come from
AdWords, Google Analytics, Firebase Analytics, Floodlight, 3rd party or custom
tags
Tag Manager allows
you to quickly update tags and code snippets on your website
You no longer need
to maintain each of these code snippets (aka tags) in your source files
You simply specify
the tags that you want to “fire” and when you want them to fire
Think of a tag fire
as a trigger for an action or event
Common “trigger”
include:
– Clicks
– Views
– Downloads
– Scrolling
– Submissions
– Purchases
Tags can become
overwhelming to a lot of people, so there are some templates available to
assist in execution
Examples of triggers
that would fire a tag:
– Click to call
– Clicks on external links
– Social media activity
– PDF download
– Form submission
– e-mail address click
– Video play
– Ad activity
– Error tracking
#8: Search Console
Integration
While you don’t have
to integrate Analytics with Search Console, you should want to do so
Search Console
integration helps bring back some of the “not provided” data
Data will only be
available for 90 days, since this is the limit for Search Console
Analytics reports
under the Search Console section include:
– Landing pages
– Countries with drilldown
– Devices
– Queries
Reports offer
keyword based data for:
– Impressions
– Clicks
– Click through rates
– Average position (across multiple
URLs)
– Sessions
– Bounce rate
– Pages per session
– Transactions and revenue
– Goal conversions, values, and rates
Data won’t match
100% between report types and here is why:
– Disabled JavaScript in browsers
– Missing Analytics tracking code
– Search Console display limitations
– Bot filtering
Reports can be
confusing because:
– One keyword can show data for many
pages
– One page can show data for many
keywords
This confusion goes
away if you drill further down into the default reports
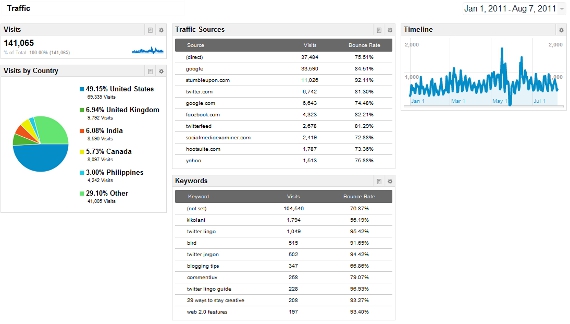
#9: Custom
Dashboards
Benefits:
– Get quick access to data
– View most important data
– View data like you want
– Create dashboards from scratch
– Grab and import templates (over
19,000 available)
– Modify templates as needed to fit
your needs
Limitations:
– 20 private dashboards
– 50 shared dashboards
– 12 widgets per dashboard
Template categories:
– Acquisition
– Analytics Academy
– Campaign
– Conversion
– Display Advertising
– Ecommerce
– Engagement
– Lead Generation
– Site Optimization
– Branding
– Mobile
– Organic Search
– Paid Search
– Publishing
– Referral
– Social
– Support
#10: Scheduled
Reports
Schedule up to 400
reports from existing screens or custom dashboards
You can export
reports as:
– CSV
– TSV
– TSV for Excel
– Excel (XLSX)
– Google Sheets
– PDF
You can select to
send reports:
– Daily
– Weekly
– Monthly
#11: Google Data
Studio
Create unlimited
Data Studio custom reports
Combine data into
reports from sources like:
– Analytics
– Search Console
– Adwords
– YouTube
– Google Sheets
– APIs
Create 100% unique
reports
Use templates for
faster deployment
Benefits:
– Lots prettier than Google Analytics
or Google Search Console
– Google is pushing product updates
monthly
Limitations
– You need to define data sources
before you can use the studio
– Not overly intuitive
– Easy to break report layouts
#12: Mobile Access to Reporting
Get your Analytics
data on the go with mobile apps Check key metrics via standard reports
Compare date ranges
Monitor real-time data Build your own reports
Save any reports to
your dashboard