Here are some of the top 10 tools that you can use to gain more understanding about your website traffic - By Akash Dixit
1.
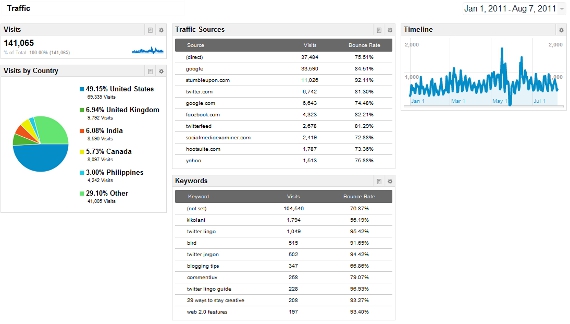
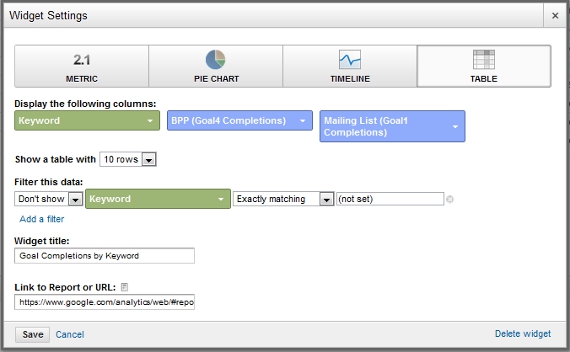
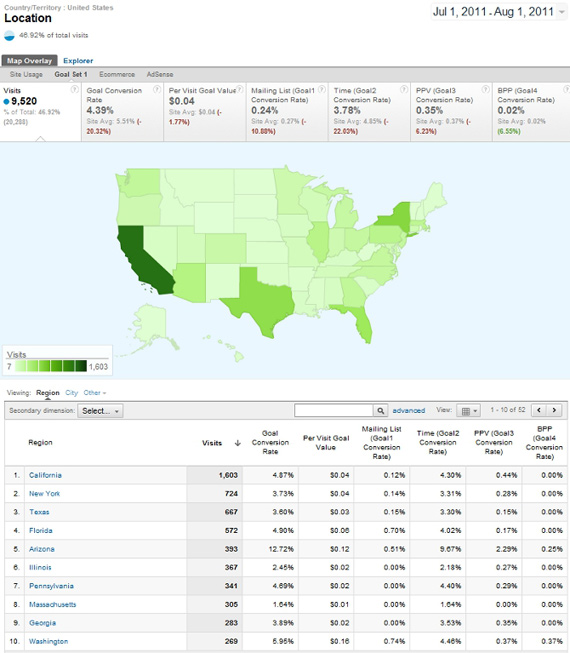
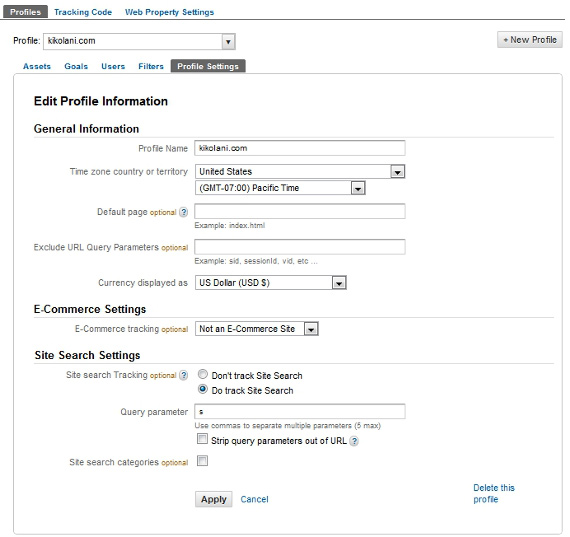
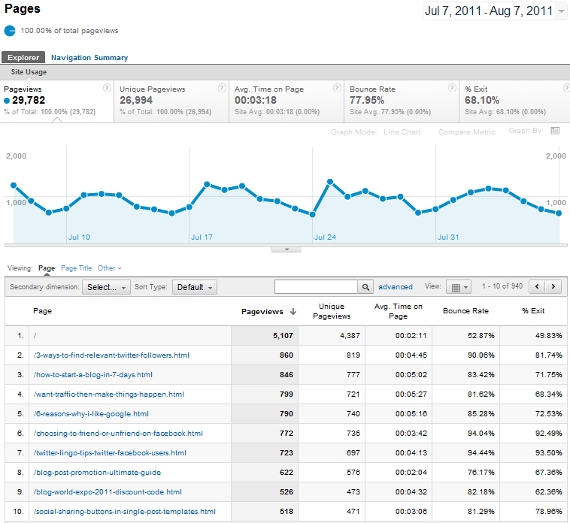
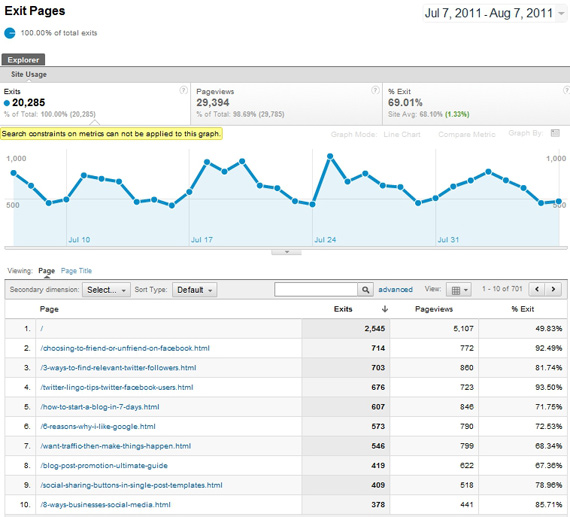
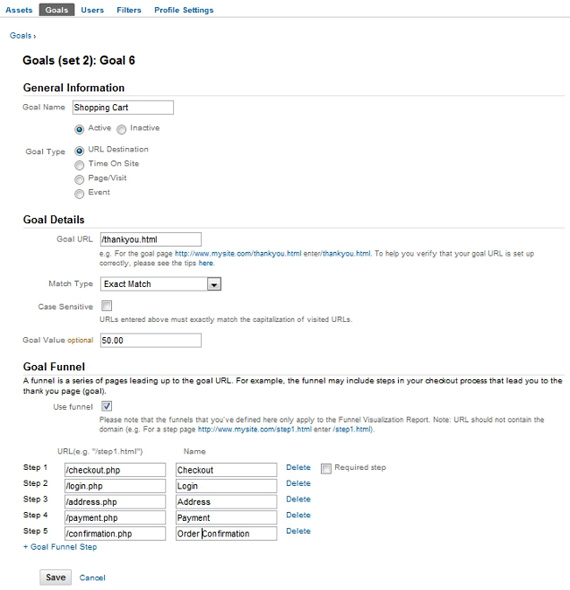
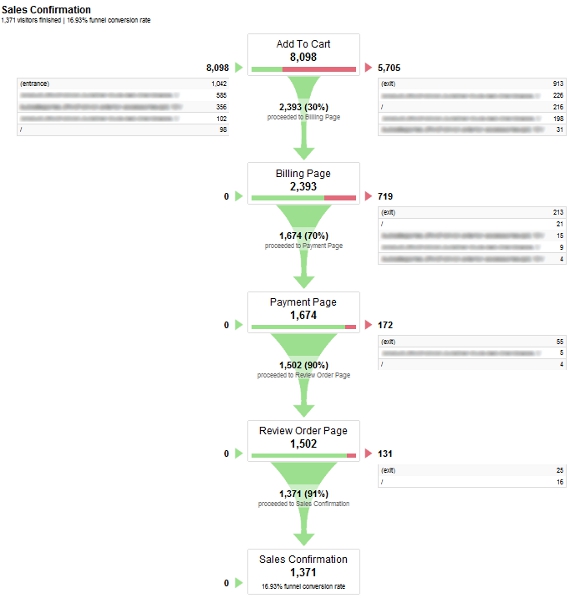
Google Analytics.
Google Analytics is
one of the best free tools that any website owner can use to track and analyze
data about Web traffic. You get to see what keywords are bringing the most
visitors to your pages and what aspects of your designs are turning them off.
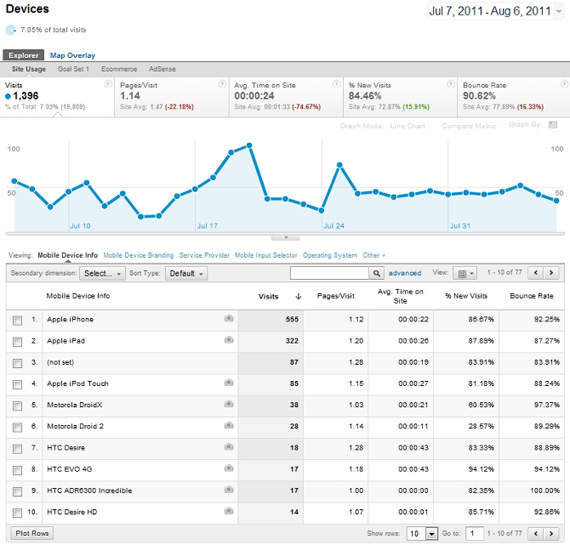
This tool will generate a report for your website that includes information
about visitors, traffic sources, goals, content and e-commerce. The downside of
Google Analytics is that it can take time to update. (The real-time version is
still in beta testing.) There are other tools that offer real-time updates of
your data now.
2.
Spring Metrics.
Spring Metrics has
taken the analytics tool and made it simpler. You don’t have to be a
professional data-miner to get the answers to your questions. You get real-time
conversion analytics, top converting sources, keyword analytics, landing-page
analysis, e-mail performance reports and simple point-and-click configuration.
Unlike Google Analytics, Spring Metrics tracks a visitor’s path through your
website from the time he landed to the time he left. All of this is included in
Spring Metrics’ Standard Plan for $49 a month. When you first sign up, you get
to try it free for 14 days. The simplicity of this tool has a lot of website
owners switching over from Google Analytics.
3.
Woopra.
Woopra is
another tool that offers real-time analytics tracking, whereas Google Analytics
can take hours to update. It is a desktop application that feeds you live
visitor stats, including where they live, what pages they are on now, where
they’ve been on your site and their Web browser. You also have the ability to
chat live with individual site visitors. This can be a great feature for your
e-commerce site to interact with customers. Woopra offers a limited freebie
plan as well as several paid options.
4. Clicky.
Clicky also offers a free service if you
have only one website and a Pro account for a monthly fee. You get real-time
analytics, including Spy View, which lets you observe what current visitors are
doing on your site. Clicky's dashboard is simple to use and presents all the
information you want to see clearly. They also have a mobile version that makes
it easy for you to check your stats anywhere.
5. Mint.
Mint is an analytics tool that is
self-hosted and costs $30 per website. You get the benefit of real-time stats,
which you don’t get with the free Google Analytics. You can track site
visitors, where they are coming from and what pages they are viewing. And
Peppermill, a part of Mint, lets you make any adjustments to make it more
compatible for your use with tons of free add-ons.
6. Chartbeat.
Chartbeat lets users get the most from their
data with instant information. They keep constant watch on your visitors and
what they are doing on your website. This gives you the information you need in
order to make the adjustments necessary to your content or design. You get a
free month when you sign up and after that plans start at $9.95 per month.
7. Kissmetrics.
Kissmetrics is another analytics tool that
allows clients to track the movements of individual visitors throughout their
websites. You can see how behaviors change over time, identify patterns and see
the most typical and recent referrers, among other stats. It offers a “Timeline
View” of visitor activity in an easy-to-understand visual format. You can try
this service free for 30 days. Plans start at $149 a month, depending on how
many events are tracked.
8. UserTesting.
UserTesting.com is a unique way to gather
information about site users. You are paying for a group of participants of
your choosing to perform a set of tasks on your site. The user and his activity
will be recorded on video. In about an hour, you will have your feedback. You
get to hear the actual thoughts of users in your target demographic. The cost
is $39 per participant you choose. You may choose anywhere from 1 to 100
testers.
9. Crazy Egg.
Crazy
Egg uses
the power of Heatmap technology to give you a visual picture of what site
visitors are doing on your Web pages. It shows you where people are moving
their mouse on the page and where they click. There is a link between where
people put the mouse and where they are moving their eyes. So, this kind of
tracking helps you see what areas are catching the most attention and
interaction from users. There is a free one-month trial with this service, and
prices start at $9 month for 10 Heatmaps.
10. Mouseflow.
Mouseflow is somewhat of a combination of
UserTesting and Crazy Egg. You can see video of users interacting with your
website, including every mouse click and movement, scrolling and keystrokes.
You also get to view heat maps from different time periods so that you can see
the effect of changes that you make on your page. Pricing varies depending on
how many sites you want to cover and how many sessions you want. For a single
site and up to 100 recorded sessions, there is no cost. Over that, prices start
at $13 a month.
What
analytics tools have you tried out for your website? What do you like best?
John
Jantsch is a marketing consultant, speaker and author of Duct Tape Marketing and The Referral Engine and the founder of the Duct Tape Marketing
Consultant Network.