Google Analytics 5 took the best features of their analytics program and made it even easier to use with new organization and visualization features. Here are nine awesome things you can do with Google Analytics 5 that will help you get the most out of your analytics information and use it to improve your website’s content, conversions, and user experience.
1. See your most important analytics data first.
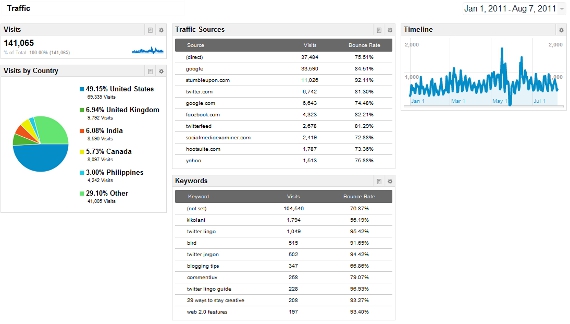
If there is one (or more) pieces of data you want to see at a glance every time you login to your analytics, be sure to set it up in the Dashboards area.
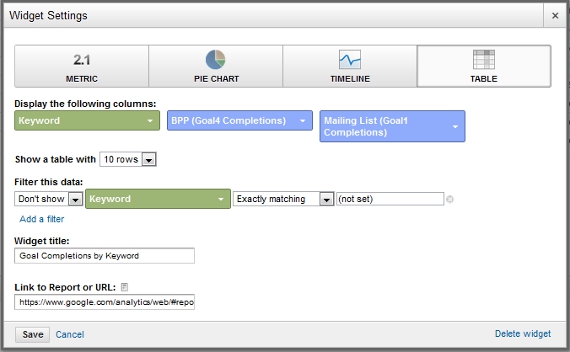
You can create multiple dashboards, each of which can contain multiple widgets. To create a new dashboard, simply go under Dashboards in the menu bar of your analytics and then select New Dashboard. Then add your widgets. You can choose from widgets that show you one particular metric, a pie chart comparing metrics, a timeline of one to two metrics, or a table showing a dimension with two specific metrics. Each type of widget can also be filtered.
The best part of the dashboards is you can change the date range and see all of your widgets update with that date range’s data. This is great if you want to see an overview of your stats for traffic, goal completions, and other metrics of your choosing all in one place.
2. Find out which online campaigns bring the most traffic and conversions.
Have you been curious which of your online marketing campaigns (anything from local search to social media marketing) are the most successful in terms of bringing traffic and conversions to your website? Then it’s time to look at your advanced segments.
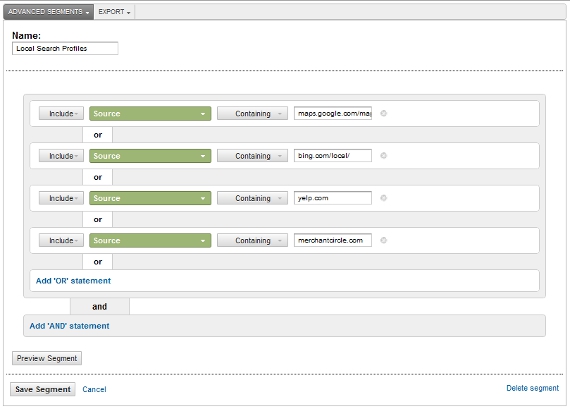
To create an advanced segment, click on the Advanced Segments dropdown and then the New Custom Segment. If you wanted to track traffic from local search directories, then call your custom segment Local Search Profiles and start entering the sites you have profiles on such as maps.google.com/maps/ for Google Places and yelp.com for your Yelp listing.
Once you have entered all of the domains you want to track, you can preview the segment to ensure it is pulling the right data and then save the segment. To view it, click on the
Advanced Segments, check the custom segment you want to view and click apply. Now you can see all of your traffic and goal conversion data that arrives from those sources which will give you a good idea of what is working the best for your website. With the right custom segments, you can find out the
ROI of your social media campaign as well as your other online marketing strategies.
3. Determine where your best visitors are located.
Have you considered using advertising via Google, Facebook, StumbleUpon, or other services? If not, it might be a daunting task to determine who you should target during your ad setups. Many of them will ask if you want to focus on a specific country or target your ad worldwide.
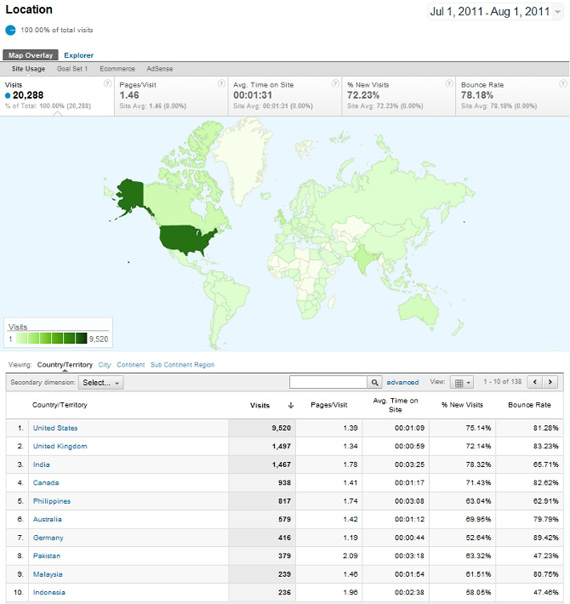
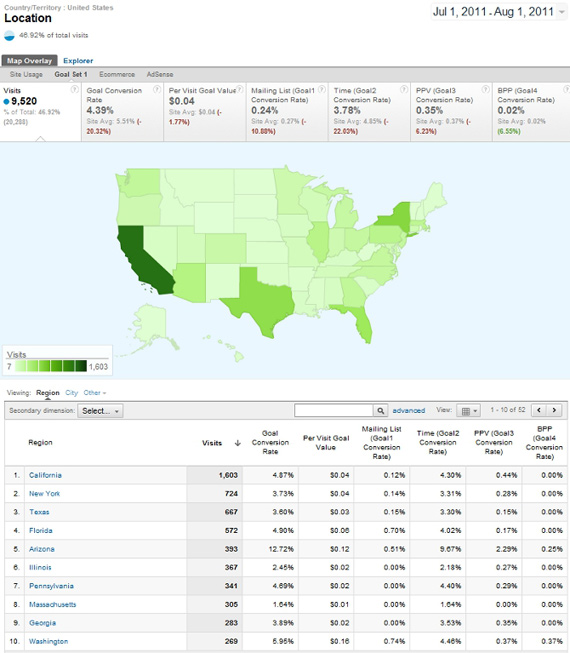
Thanks to Google Analytics, you don’t have fret any longer. Simply look under your Visitors menu to see the Location demographics of your visitors.
Here, you can see your worldwide stats, including the average time on site and bounce rate of visitors from particular countries. You can also drill down to particular countries and see these stats as well as your goal conversion rates in particular regions.
Now you will know the specific locations whose visitors bring you the most conversions. Targeting visitors in these locations with your ads will result in even more goal completions for your site.
4. Learn what people are searching for on your site.
Most people know how to find the keywords that bring visitors to their sites from search engines. But how would you like to go beyond that to find out what visitors are searching once they are on your site?
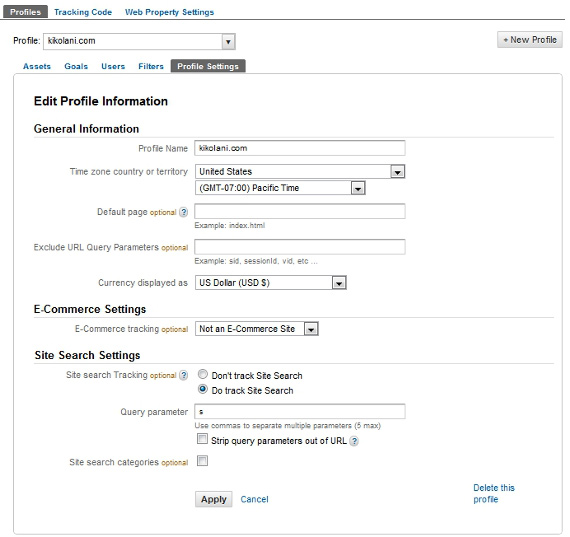
If your website has a search box, go ahead and perform a search to see the URL of the search results. As an example, my blog’s search results URL is http://kikolani.com/?s=blogging. Once you have this for your site, click on the settings wheel icon in the top right corner of your Analytics menu bar and find your Profile Settings. Under Site Search Settings, select the option to Do track Site Search and enter s as the query parameter (or the one that fits your site’s URL structure).
To see the results of this setup, go to the Content menu and the Site Search area. Under Usage, you can see what terms are being searched for, if visitors refined their search, continued browsing your site, or exited which will let you know if they are finding what they want. Under Pages, you can see which pages people are upon when they decide to use the search feature. When you click on each page, you can see what terms they searched for.
Site Search can help you determine if people are finding what they are looking for on your site. It can also give you ideas of which pages of your content need more specific information as well as the new content you can create on your site to further engage your visitors.
5. Visualize what people click on the most.
Curious where people are making the most clicks on your site? In-Page Analytics under the Content menu will pull up your website in the Analytics browser with information on the percentage of clicks that have happened on each internal link on your site.
You can hover over each link to see additional details and click through to more pages on your site to see more details. This can help you visually see what areas of your site are the most popular, and help you identify where people are clicking on your site. So if you have a particular link you want visitors to see, you should be sure to place it in the areas of your website that receive the most clicks.
6. Uncover your top content.
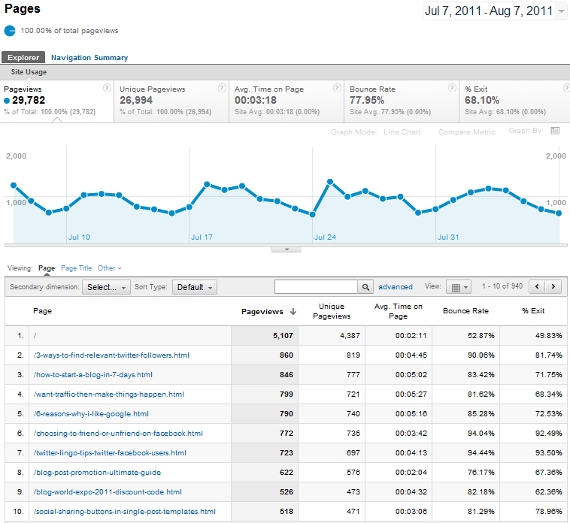
Want to know which pages keep your visitors on your website the longest, or have the lowest bounce rate? You can see this quickly by going under the Content menu and selecting Pages under Site Content.
This section can help you identify which pieces of content keep visitors on your site the longest and lead to them wanting to continue onto more pages on your site. This can help you produce more content that people will like in the future.
7. Identify your worst performing pages.
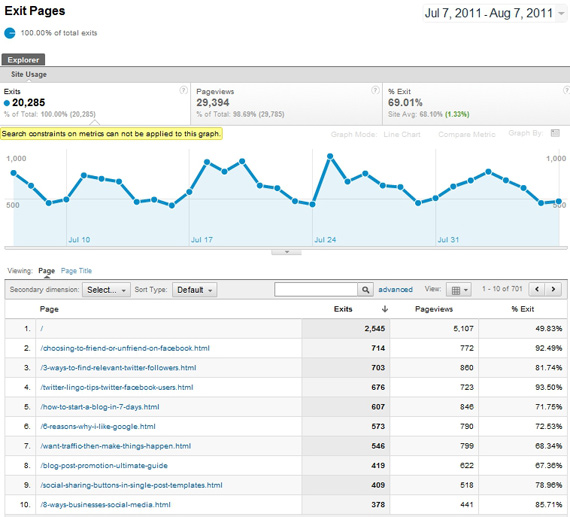
A few items down in the content menu from your top pages are your top exit pages. This will tell you how many people are arriving and exiting on a particular page.
This is somewhat common for blogs as people are coming to find a particular piece of information and then leave (hopefully) satisfied. But for other websites, it may signify that people are not finding what they are looking for on that page and then leaving. This may mean that you need to evaluate your site’s content to ensure that visitors are finding what they want and getting a call to action so they get where you want them to be before they leave, such as subscribing to a mailing list or purchasing a product.
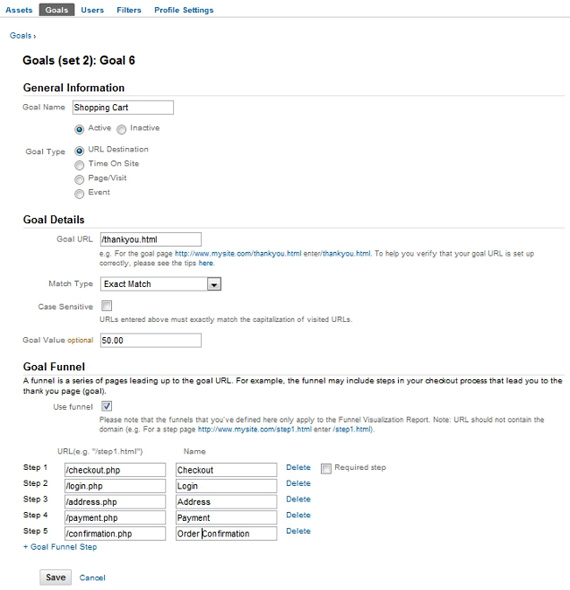
8. Determine where people abandon the shopping cart.
Does your website have a multiple step checkout process? If so, you should setup a goal for your website using a Goal Funnel. To do so, click on the settings wheel icon and click on Goals. Create a new goal with the Goal Type of URL Destination. After you enter the basic goal details, including the final URL of the checkout process (usually a thank you for your order page), then check the Use funnel box to enter each of the URLs that correspond to the steps a visitor must take when purchasing an item.
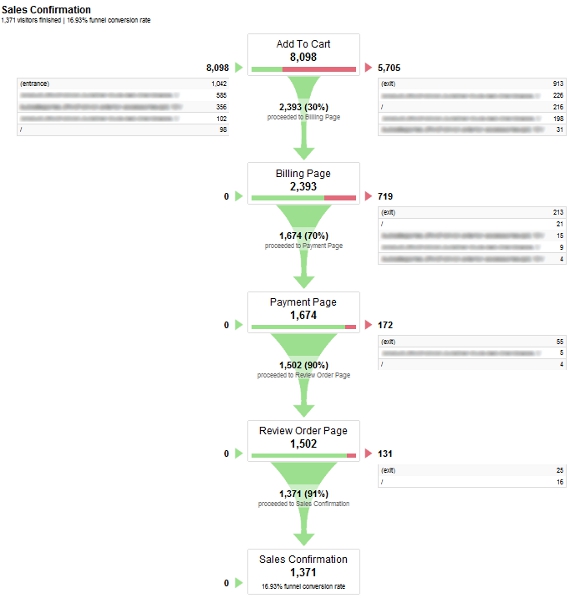
By using this setup, you will then be able to view reports showing you when people abandon their shopping cart during their purchasing process.
If you note a particularly high amount of people who exit on the payment page, you’ll know that you need to do some work in order to make that page more shopping friendly. Or if people exit before confirming their order, you’ll know that there is something missing that is making people not want to click that final button. Fixing these issues can lead to more sales in the long run!
9. Discover if you need a mobile site.
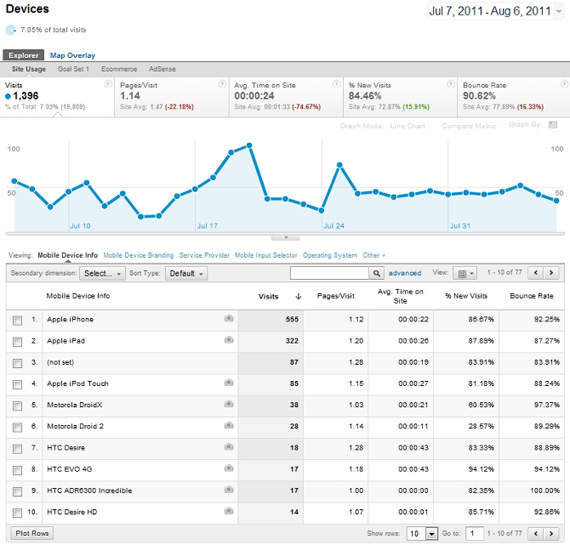
Have you been wondering if you need a mobile version of your website? Find out by looking under the Visitors menu. There you will find a Mobile option where you can see all the way down to a specific device and the percentage of your total visits that are from a mobile device.
The key on this screen is looking at the average time on site and the bounce rate. If your average time on site is lower and the bounce rate is higher than your overall numbers, then you’ll know that you’re losing that much of your mobile traffic.